What is the 5M method?
The 5M method is a project management tool for analysing the causes of a problem. It is structured around the 5Ms, which designate the main families of possible causes for a malfunction.
History: The 5M method was created by the Japanese professor Kaoru Ishikawa (1915-1989), hence the name “Ishikawa method”.
The 5 families (the 5Ms) are
- The Workforce: the organisation’s staff, skills, motivation, numbers…
- Material: equipment, machines, software and hardware…
- Materials: consumables, elements processed in the production chain…
- The Method: way of doing things, procedures, instructions…
- The Environment: environment, working conditions, relational aspects…
The 5M method is sometimes completed by other aspects, such as the Measure, which refers to the method of measurement, calibration or the readability of the results. When this family of causes is added, the 5M method becomes the 6M method.
It can also be completed with the following elements:
- Money, which refers to sources of funding,
- Management, which refers to hierarchical responsibilities and decision-making.
Drawing up the Ishikawa diagram
The Ishikawa diagram, also known as the cause-effect diagram or the 5M diagram, aims to identify and organise the causes of a problem into large families, in a visual way. It is therefore the visual tool of the 5M method. The process of constructing this diagram is carried out in several stages:
- Identify the problem,
- Think about all the causes that could explain the problem, in the form of a team brainstorm,
- Drawing the Ishikawa diagram, to graphically represent the causes of a problem and rank them.
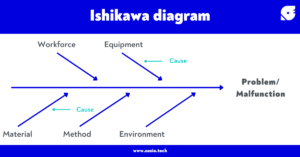 The Ishikawa diagram consists of a continuous line or arrow that indicates the problem. On the far left, the name of the problem is written as specifically as possible. Once the problem has been specified, the next step is to draw 5 branches that will point to the continuous line. These 5 branches are the 5Ms, which, as we have seen, represent the main families of causes of a given problem.
Once these 5 branches have been drawn, the causes listed during the brainstorming are taken up again and divided into the different families of causes.
The last step is to list the action plan to reduce or eliminate the causes of the problem.
Ishikawa diagram: example of production delay
Let’s take a first example of a problem in a factory: a production delay.
In our problem, the factory suffers from a production delay. An analysis is then carried out by the managers and operators of the factory to identify, during a brainstorming session, the potential causes of this delay.
The production delay can be due to multiple factors, which are classified into the major families (5M). The following causes are identified:
- Manpower: lack of motivation, lack of personnel and lack of training.
- Equipment: failure of electrical equipment, damage to certain machines.
- Material: delay in raw material supplier, shortages.
- The Method: lack of supervision.
- Environment: overly intensive working conditions and poorly organised environment.
After identifying and sorting out these causes, the teams can find appropriate solutions to improve the problem. They can then focus on the causes they consider to be predominant. In our case, for example, they can apply the 5S method to improve the working conditions and the organisation of the environment, and thus restore motivation to the operators.
Ishikawa diagram: example of a drop in customer satisfaction in a clothing shop
Let’s take another example: a drop in customer satisfaction in a clothing shop.
In the same way as in the previous example, an analysis is carried out to identify the potential causes of this dissatisfaction. The dissatisfaction is due to supply problems, long waiting times at the checkout, a gloomy environment and a printer failure.
From this information, the causes can be sorted as follows:
- Manpower: lack of motivation, lack of staff and lack of training.
- Equipment: insufficient number of cash registers, delivery trucks often breaking down.
- Material: waste of paper (faulty printer).
- The Method: lack of procedures.
- The Environment: lack of lighting.
In the same way, it is a question of finding appropriate solutions to improve the problem. In our example, it might be appropriate for the shop to invest in lighting and cash registers to limit the causes of the malfunction.
Why use the 5M method?
Thanks to the 5M method and its horizontal visualisation tool, the faulty phenomena are better identified. By finding the root cause of the problem, this method not only creates an optimal environment in the teams for an effective search for solutions, but also anticipates other causes that could aggravate the problem
Written by Emma Guignard