
Our no-code KPI engine analyzes your container fleet’s use and informs you of its status over time. This data is crucial for the accurate sizing of your container fleet for your production.
ROBIN Performance Management
Optimize processes and improve performance with the ROBIN Performance Management service level integrated into the ROBIN app.
Developed by Zozio, it enables you to analyze your production performance, and better plan and reorganize your production equipment.
The analysis carried out can be deepened at the level of each type of process or product reference.
A sizable impact
Get informations about transit times between two zones – indoor and outdoor – as well as on volumes. At a glance, you can identify problematic production flows.
Get a precise overview of the lead time for work-in-progress at every stage of your process and anticipate delays in your deliveries.
Maximize the use of your assets by visualizing their turnover rate in the process.
Your inventories are quantified over time according to products and processes, with precise data and you have visibility of downtime rates by zone.
Process flow analysis – or VSM analysis – is automated, enabling you to plan with greater precision.
All this is made possible thanks to the various modules and widgets detailed below and integrated into the ROBIN Performance Management service offering.
Process flow diagrams (VSM)
With process flow diagrams – or VSM (Virtual Stream Mapping) – you get a graphical view of asset flows between each zone and their value.
Process flow matrix
The process flow matrix gives an average of asset flows per zone and their value.
Asset movement diagram
This feature gives you access to information on asset duration by zone and asset value.
Detailed movement chart
This module gives a breakdown of asset arrival times by zone, on a timeline.
Asset movement history
Access the history of asset distribution, duration by zone, asset value.
Asset immobilization matrix
The asset immobilization matrix shows retention by storage zone at a glance. So you can target your continuous improvement efforts and better size your buffer zones.
Tell us more about your project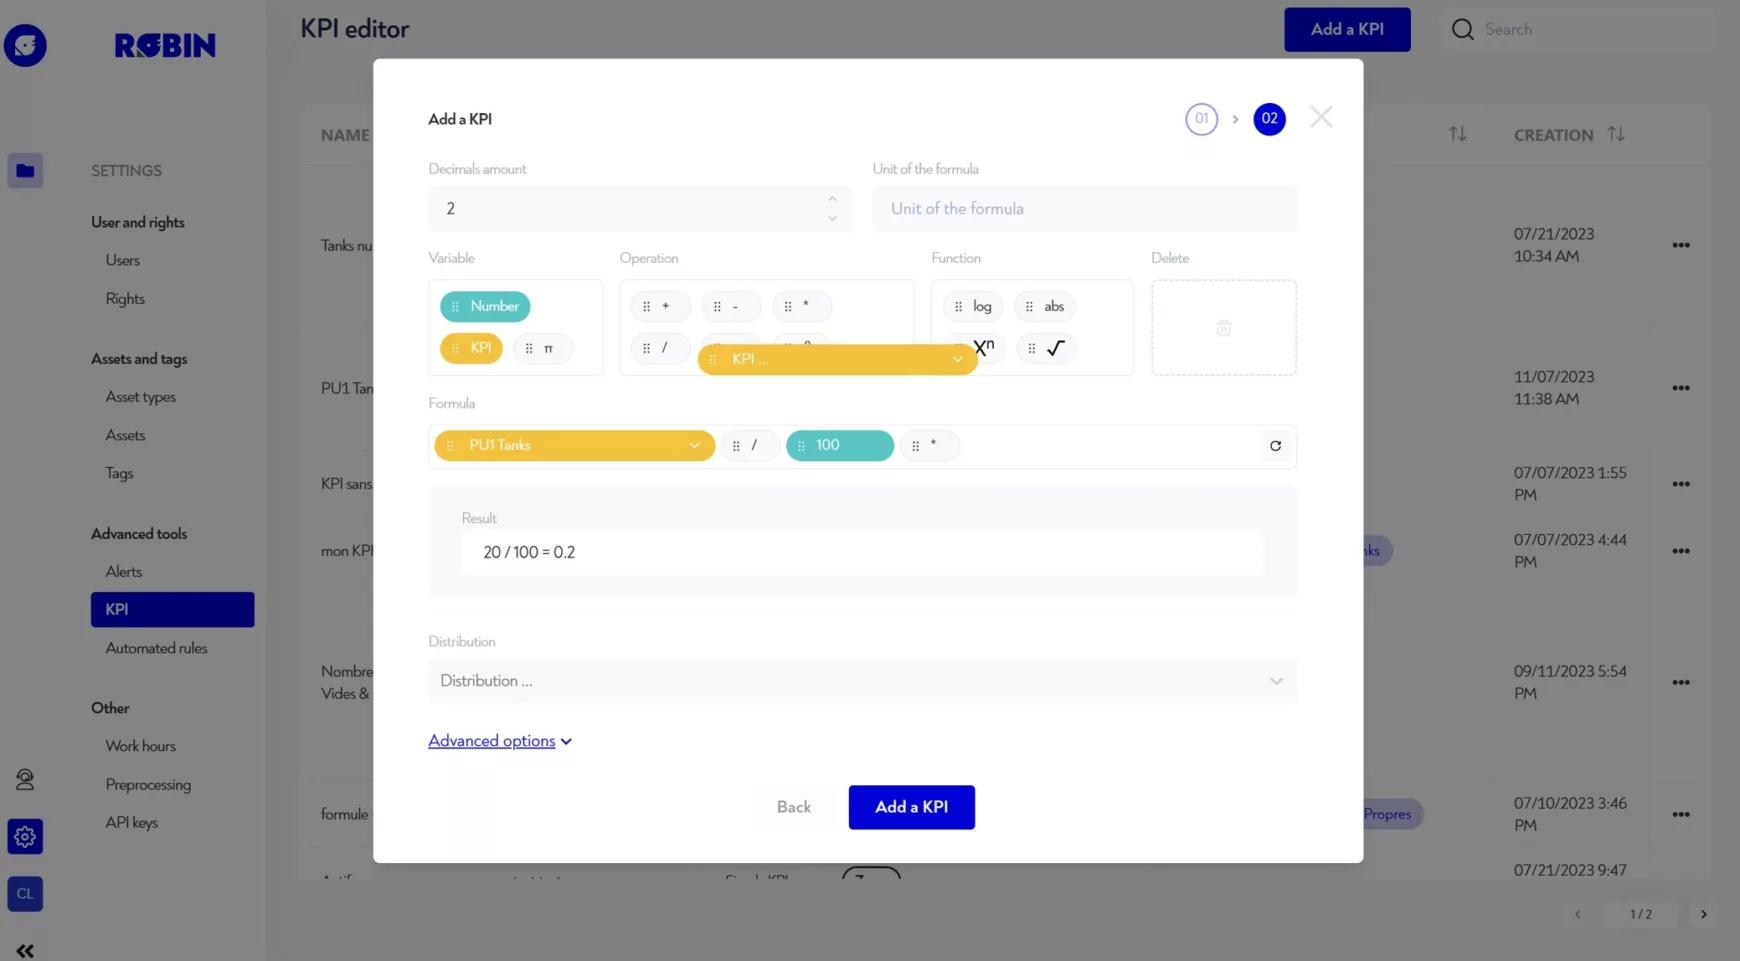
Asset utilization rate
Questions - Answers
-
01 Which KPIs to drag from this?
Once your continuous improvement actions have been implemented, you can compare between two production periods and observe the impact of the actions taken:
– Analysis of your lead times to determine production times at each station and identify problematic stations,
– Analysis of your container rotation rates to identify the frequency of their use and reduce their cost,
– Analysis of fixed assets to accurately size your buffer stocks, as well as to identify product retention areas,
– Flow analysis to identify bottlenecks.
-
02 Why using ROBIN Performance Management?
ROBIN Performance Management is the third level of service of our app ROBIN. This service gives you access to the following KPI modules:
– Process flow diagram (VSM),
– Process flow matrix,
– Asset movement diagram,
– Detailed movement diagram,
– Asset movement history,
– Asset immobilization matrix,
– Asset utilization rate.
-
03 Who can benefit from this solution?
The ROBIN Performance Management solution is aimed at industrial production professionals (aeronautics, automotive, glassmaking, cosmetics, MedTech, chemicals, etc.), and more particularly at site managers, production planners and quality managers.