
Product · ROBIN.Cockpit
The entire shop floor, visible in one place.
Real-time dashboard for production: WIP Live Map, progress vs routing, alerts and operational KPIs. Operations management is based on what is happening in the hangar, not on tomorrow's report.
- WIP Live Map
- Real-time KPIs
- Proactive alerts
- Drill-down
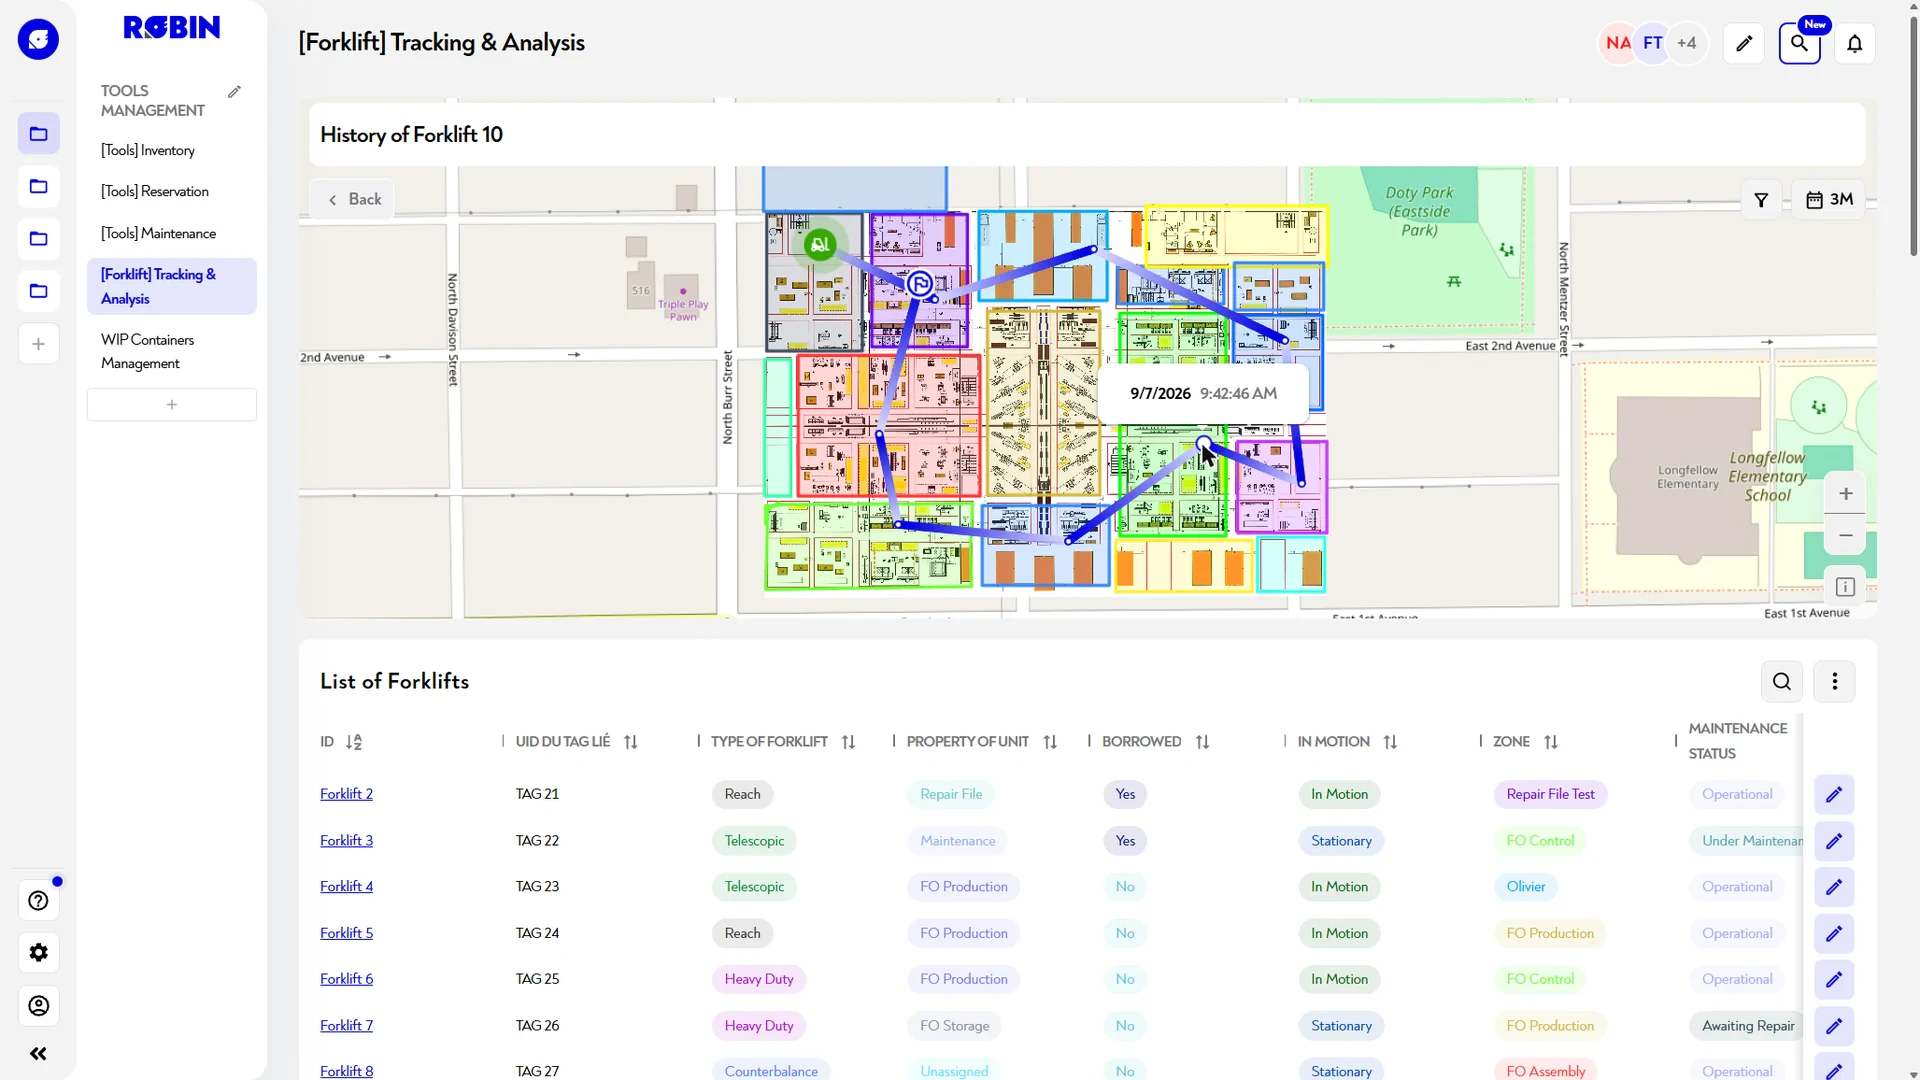
Visibility
See the real state of the shop floor
A single view shared across production, scheduling and management: the same information at the same time.
WIP Live Map
Real-time location of every WO / part on the shop floor — where it is, how long it has been there, what its status is.
Progress vs Routing
Progress of each WO compared with the theoretical routing — TAT deviations detected before they become critical.
Anticipation
React before the drift gets costly
Anomalies flag themselves and the load is read live: trade-offs are made during the day, not at the debrief.
Proactive alerts & anomalies
Automatic detection of drifts (delay, blockage, abnormally idle part) with immediate visual escalation, no need to go looking.
Live machine / resource load
Workstation utilisation rates, queues and bottlenecks identified live — an instant capacity view.
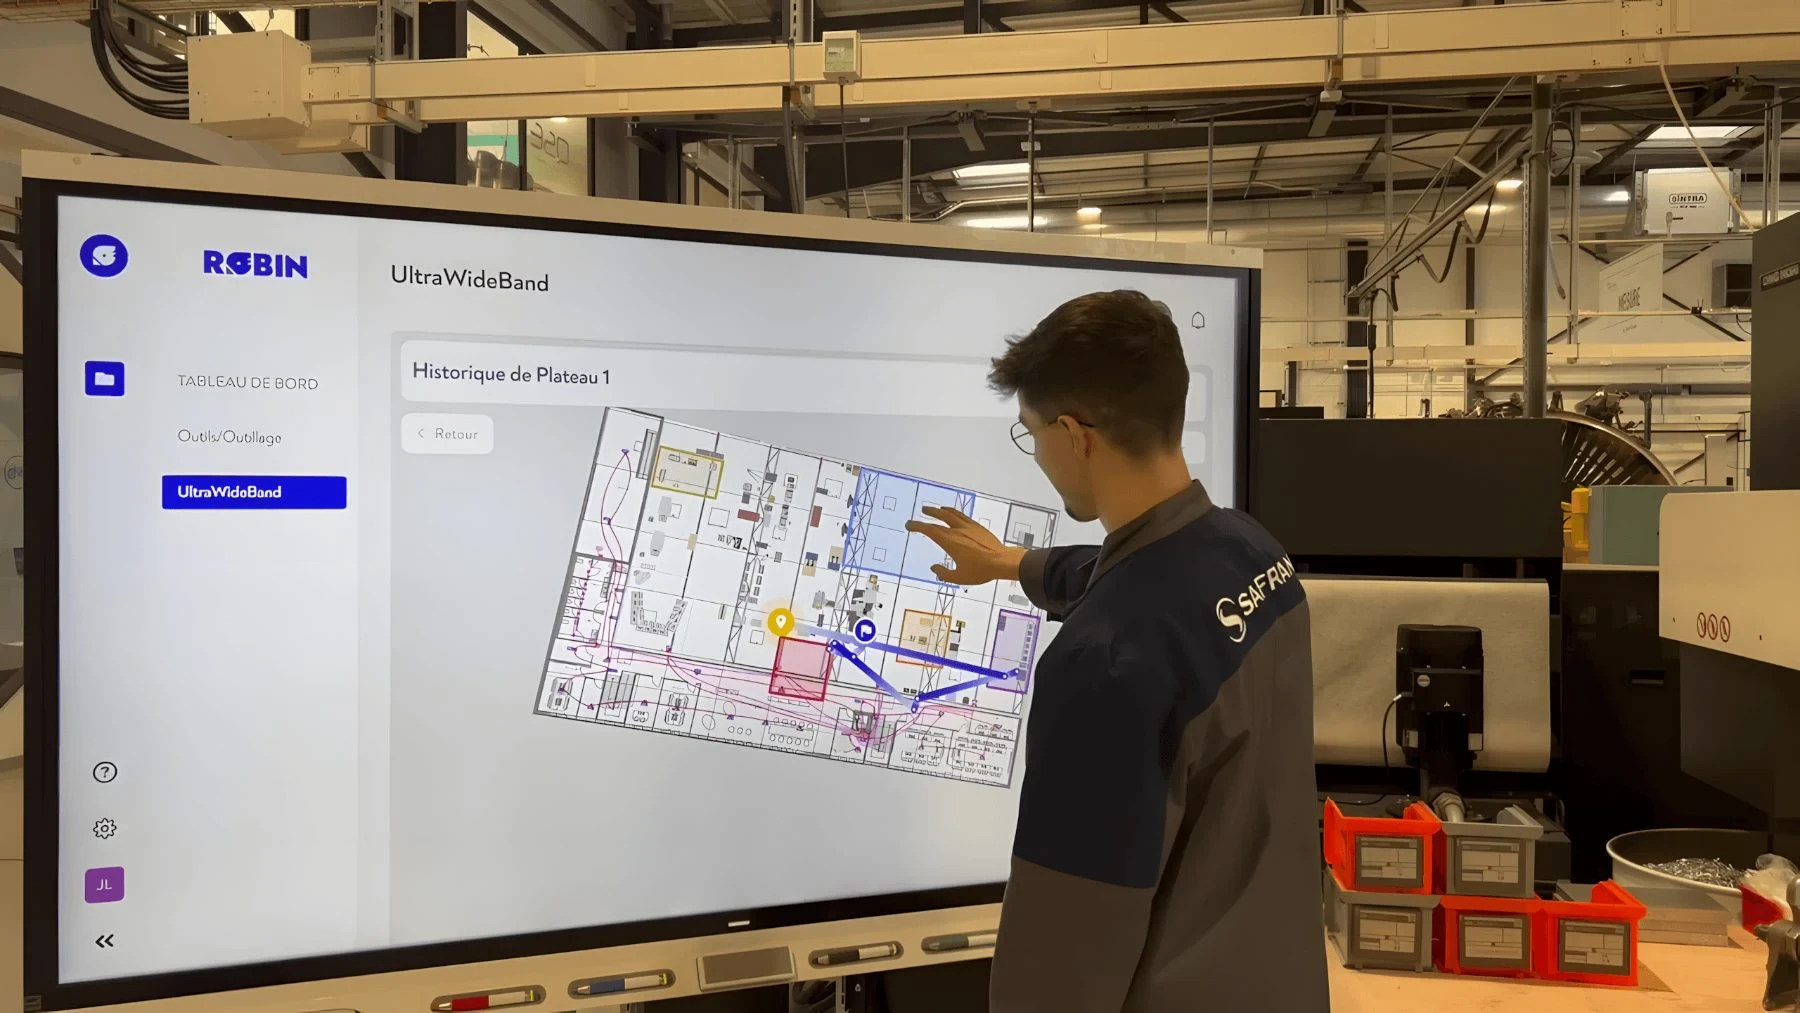
Decision
Decide on live figures
Glanceable indicators, and the ability to trace the cause in one click.
Real-time operational KPIs
OTD, average TAT, WIP, service level — glanceable cockpit-style dashboards, not next-day Excel reports.
Custom indicators
Build your own performance indicators without any development: you choose the data, the scope and the widget format. TAT by part family, waiting time at a workstation, routing compliance — the indicator that matters to you exists the day you decide it.
Contextual drill-down
From the macro (shop floor view) to the micro (detail of a WO, a part, an operator) in one click — without switching tools.
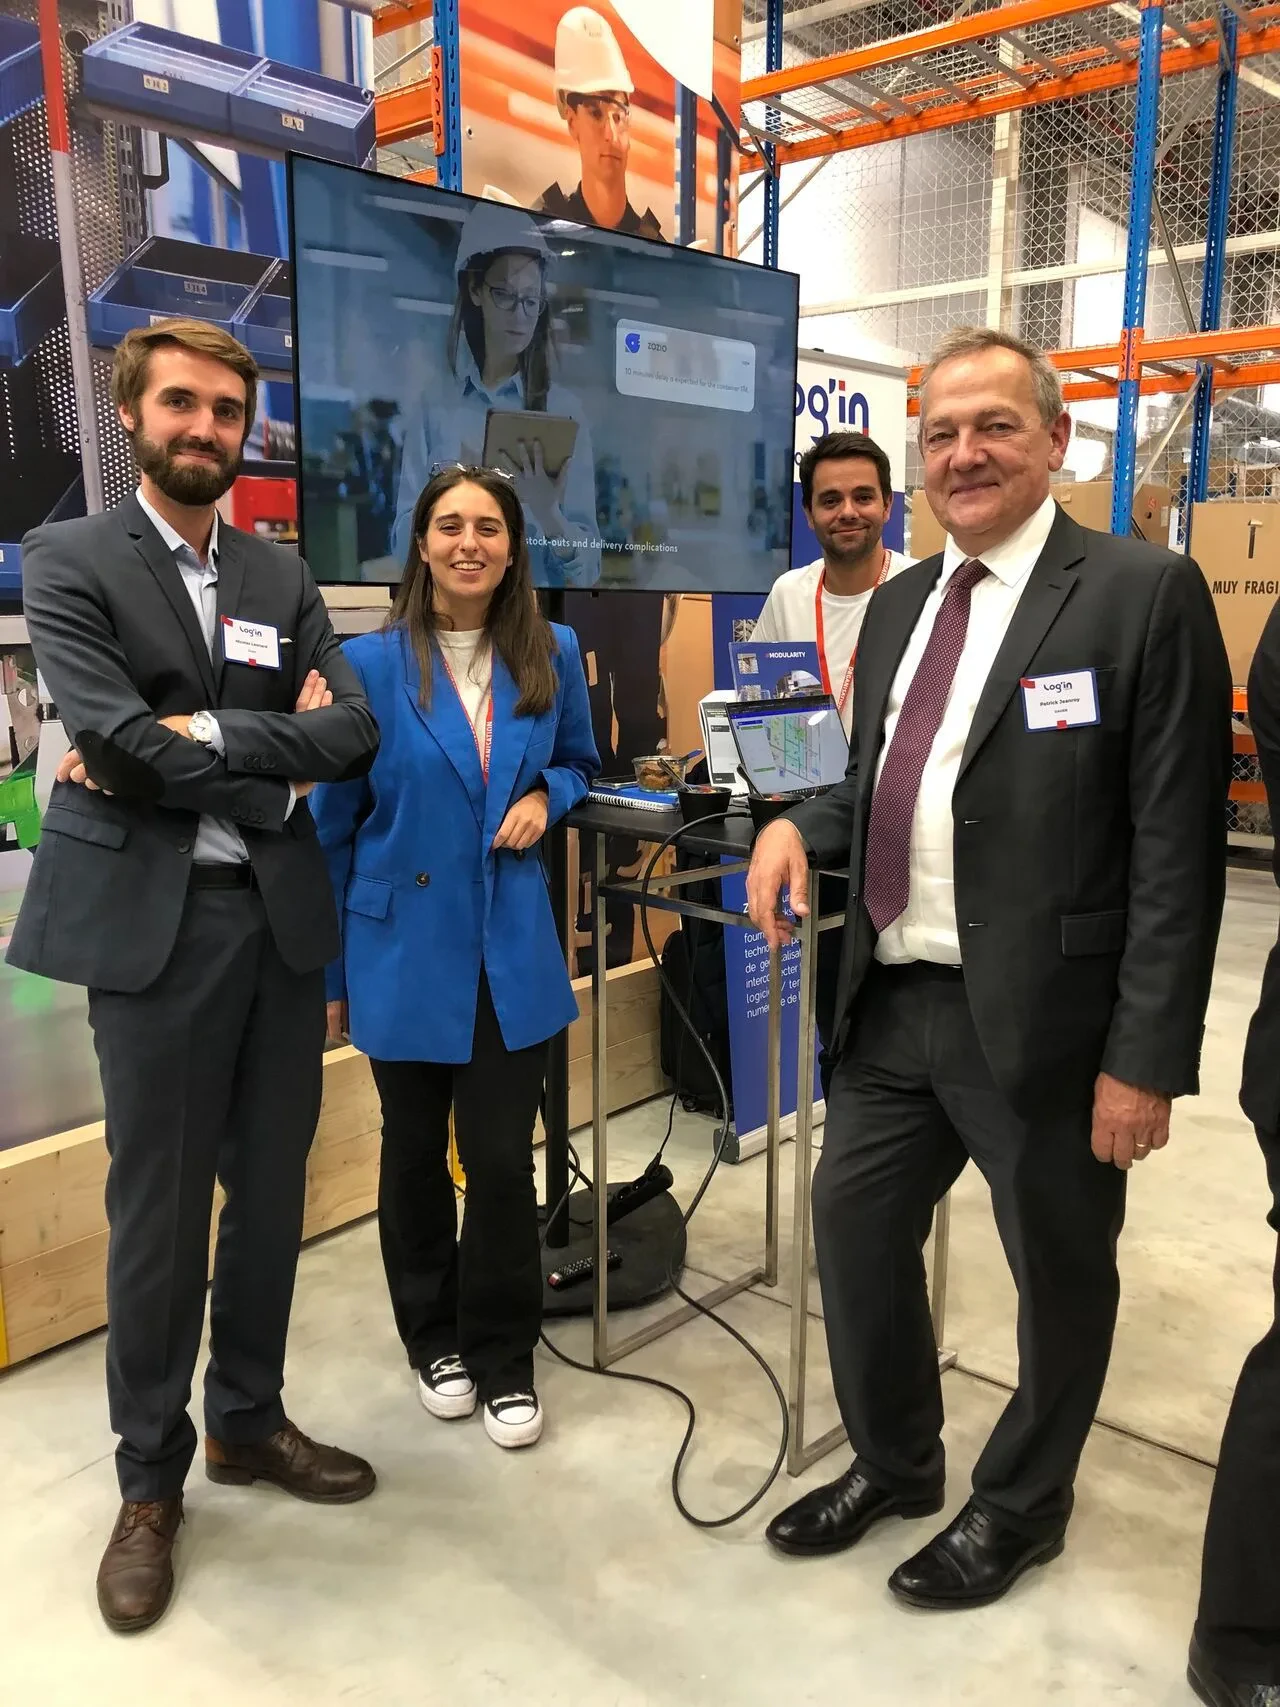
History
Replay the past to fix the present.
Real time tells you where you stand. History tells you why. Every position, every status change and every actual duration is timestamped and stored.
Continuous data historisation
Positions, statuses, operation durations and KPI values are stored continuously. History builds itself, with no export or re-entry, and the shop floor of three weeks ago reads like this morning's.
Spaghetti diagram
The actual path of a WO, a part or a resource, traced workstation by workstation. Needless back-and-forths, detours and waiting areas show up in black and white — the basis for a layout project or a Kaizen.
Access to past operations
Replay a day, a closed WO or a completed batch: duration per workstation, deviation from routing, actual waiting time. The same data serves the internal action plan and the justification to the customer.

No code
A cockpit you compose, not one you develop.
Not every team needs the same screen. You choose the widgets, the source data and the scope, save the view and share it. No ticket, no line of code, no vendor lead time.
Modular interface
Everyone gets their own view, without a line of code.
Six building blocks in the library. The scheduler, the quality engineer and the plant director don't look at the same board — and nobody has opened a ticket.
Modular interface
Build your dashboard
No widgets added1 widget added2 widgets added3 widgets added4 widgets added5 widgets added6 widgets added
Library
Click to add to the dashboard — no code.
KPI value
ASSETS DAKOTA
370 active
▲ 14 % vs yesterday
KPI value
Gauge
Gauge
Histogram
Histogram
Pie chart
- Type A · 34%
- Type B · 26%
- Type C · 22%
- Type D · 18%
Pie chart
KPI trend
KPI trend
Map
Live map
Your dashboard is empty
Add a widget from the library
Industries
The cockpit speaks the language of your shop floor.
Views, statuses and indicators are configured to the nature of the flow. See what ROBIN.Cockpit displays in your industry.
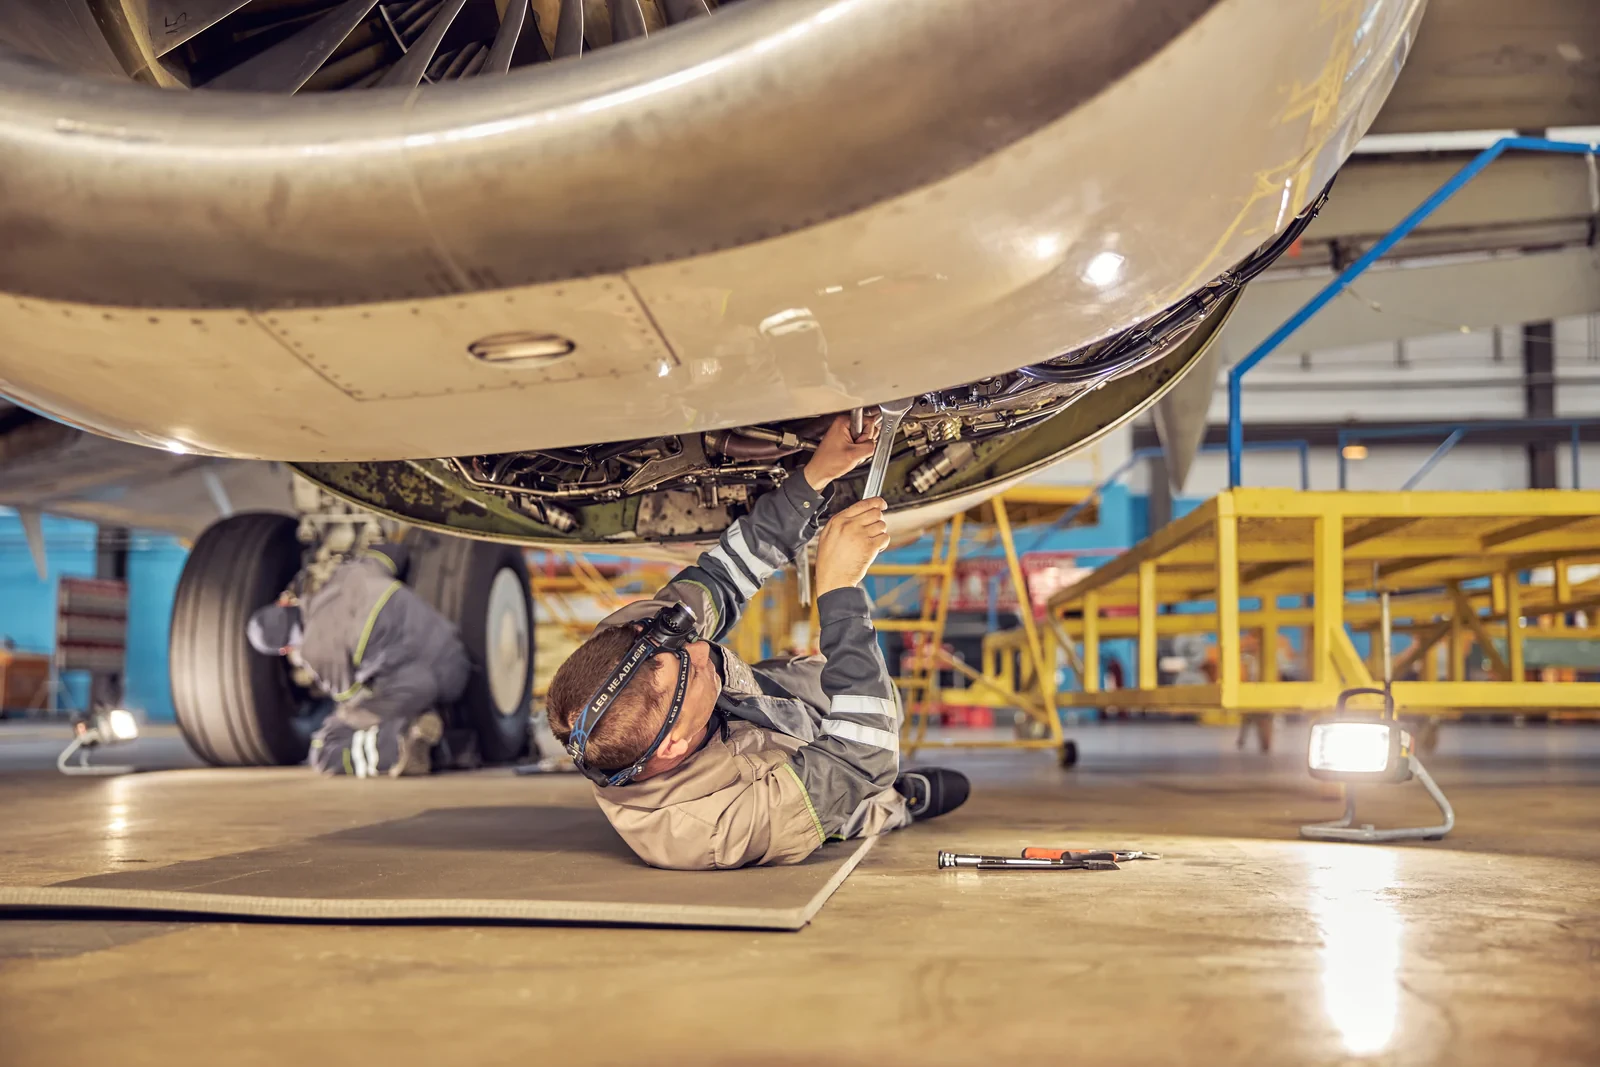
Aerospace · MRO
MRO & repair
Routing disruptions, AOG, customer parts: the flow is reshuffled several times a day.
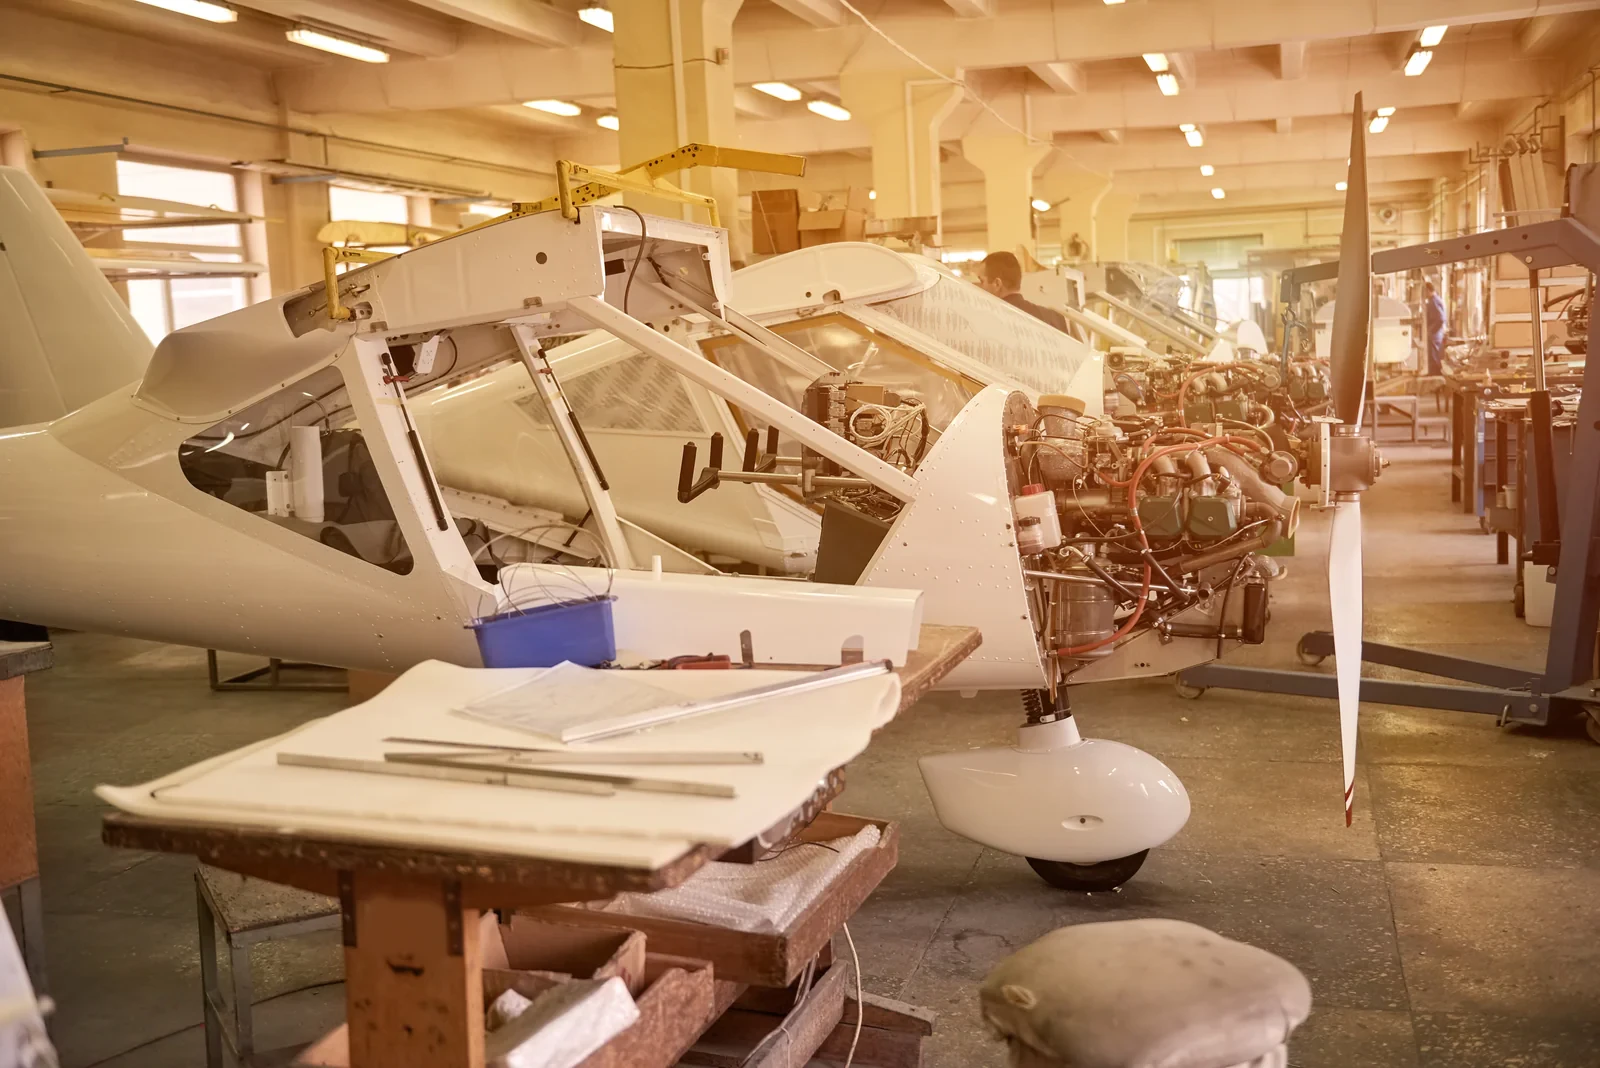
Aerospace · Production
Production & assembly
Rate, assembly stations and shortages on long series and short cycles.

Industry · Multi-industry
Manufacturing industries
Mixed flows, subcontracting and WIP scattered across several buildings.
Frequently asked questions
What teams ask us about ROBIN.Cockpit.
Which indicators are tracked in real time?
Is a dedicated screen required on the shop floor?
The cockpit displays equally well on a large shop-floor screen, a desktop workstation, or a tablet. Views are designed to be read at a glance.
How are deviations detected?
By continuously comparing actual progress against the theoretical routing, and by detecting abnormal inactivity. The alert surfaces visually, without having to search through a report.
Does ROBIN.Cockpit replace our Excel tracking spreadsheets?
How long before the first indicators are displayed?
As soon as ERP data and the first field readings come through — typically a few days after connection. Views are then completed progressively as sensors and connected workstations are deployed.
Can you create your own performance indicators?
Yes, in no-code. You choose the widget (card, table, line chart, gauge, breakdown, counter), the source data and scope, then save the view for your team. TAT by part family, waiting time at a workstation, routing compliance: the indicator is built without any development and without going through our team.
Can past operations be analysed?
Yes. Positions, statuses, actual durations, and KPI values are continuously logged. Replay a day, a closed work order, or a completed batch, and generate the spaghetti diagram of the actual path to identify back-and-forth movements and waiting times.
They use it

The tool solves operational problems that people encounter every day on the shop floor. Instead of searching for mobile equipment around the factory, team members use ROBIN, Zozio's solution. That means less wasted time and less frustration.
 All testimonials
Go further
What we write about ROBIN.Cockpit.
Article
Production weather: seeing the disruption before it hits the schedule
Anticipating is not predicting. What real time makes visible.
Article
Reaction time is the shop floor's real hidden cost
7% of TAT recovered without speeding up a single operation.
Case study
Reducing TAT in an MRO shop floor
The KPIs tracked and the effect on OTD.
In the platform
One platform, six modules.
From deployment to scheduling, each module feeds the next — a single reference base, a single flight plan.
Take action
See ROBIN.Cockpit on your data.
A demo prepared with a scheduling engineer, on your shop floor.