
Use cases · Move beyond the Excel schedule
Excel is not the problem. Excel is the symptom.
Elanco scheduled its production vessels in an Excel file. The real challenge was to replace it with something automated. But to do that, the data flows first had to be structured and integrated automatically too.
- Industry — Animal health / pharmaceutical
- Scope — 3 sites (2 United States, 1 France)
- Modules — Tracking · Workflow Control · Scheduling
- Configuration delivered — 3 weeks
Client background
The schedule is a file, so it is always behind the shop floor.
Excel is the default solution in factories. It is then the only view the shop floor can share, but it inherits every flaw of manual entry: administrative overhead, slow decision-making, no automatic update or real-time data, difficulty collecting data, only one person with in-depth knowledge of it…
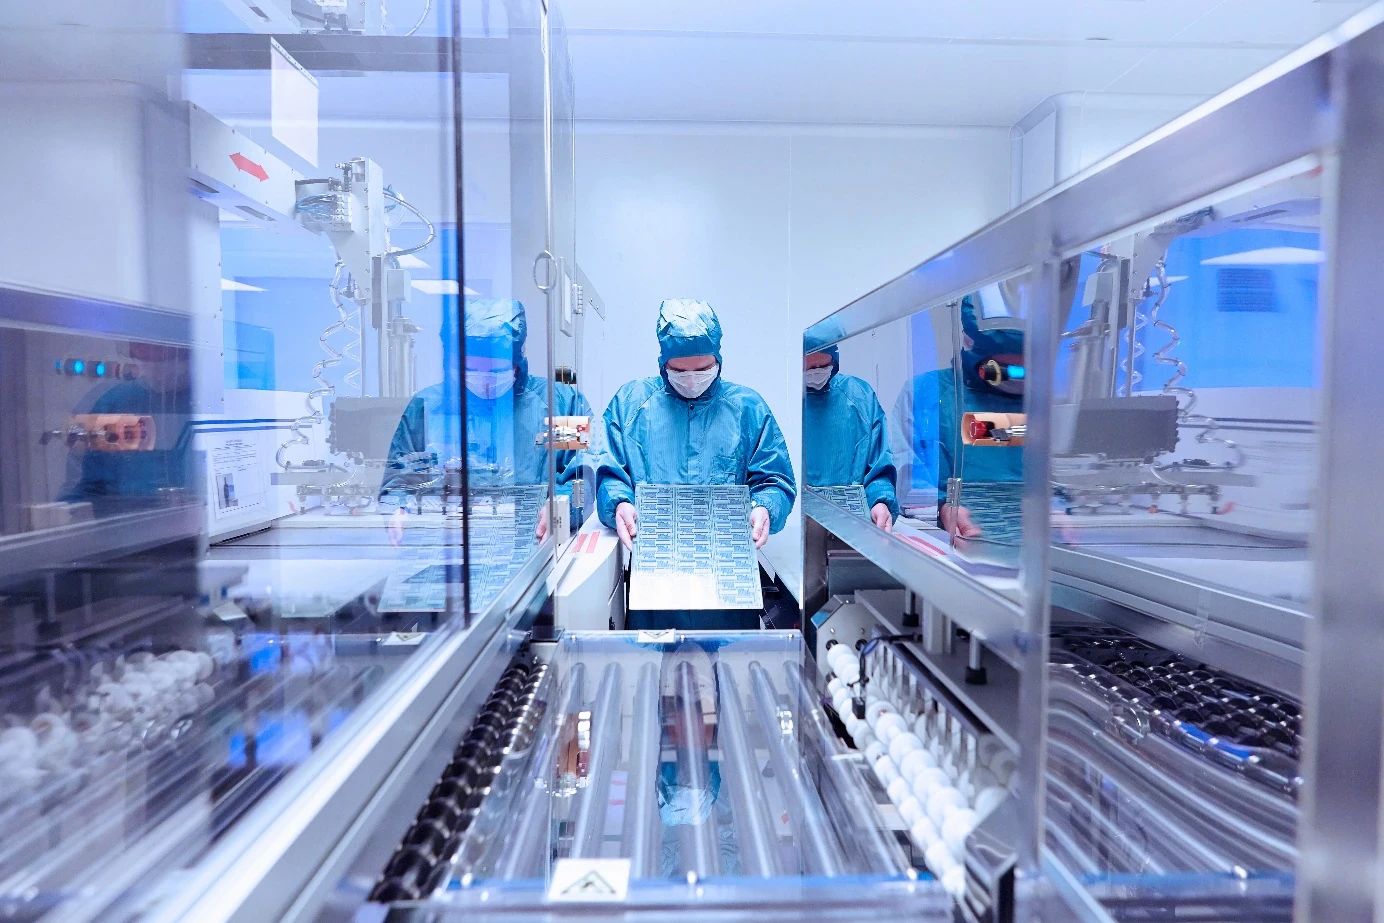
This animal health laboratory produces across three sites, two in the United States and one in France. Production vessels and containers go through regulated stages — hot rooms, cold storage, washing — with minimum and maximum dwell-time thresholds to respect. None of these stages was tracked automatically.
Daily life before ROBIN
A diagnosis representative of the pharmaceutical industry.
- The schedule is a file, updated by hand, so it is always behind the reality of the shop floor
- No automation or real-time tracking on the critical steps of the process
- Recurring dwell-time breaches of the regulatory min/max thresholds
- Losses of intermediates and finished products
- A degraded delivery capacity, with a compliance risk
- A frank internal assessment: an internal estimate of 72% human error among the discrepancies observed — the data entry, not the process
The real challenge is therefore not “replacing Excel”. It is eliminating the manual entry that feeds Excel — and for that, the shop-floor data must exist first.
The Zozio solution
The order of operations: data first, then the schedule.
This is the core of the method, and what sets this project apart from a simple tool replacement. A digital schedule without automatic shop-floor data becomes a schedule to be keyed in again.
Building block 1 — Track & trace
Making containers traceable
The project started with the set-up of track & trace for vessels and containers, with real-time indoor geolocation: autonomous wall anchors, tags fixed on the containers, data sent back to ROBIN via gateway.
- Real-time map and inventory of containers — clean, dirty, in progress
- Automatic timing of dwell times: the counter starts on entering the zone
- Container maintenance management (PM) directly in the platform
- Full traceability: the container's unique ID is matched to the batch number
Building block 2 — Thresholds & alerts
Turning dwell time into an alert
Regulatory thresholds become automatic rules. No more log sheets, no more breaches discovered after the fact.
- Incubation thresholds: min 24 h, max 48 h, with a first alert 4 h before the maximum deadline
- Cold chain: on exit, an ambient timer starts — alert at 30 h, 18 h remaining
- Cold room transfer possible after 12 h
- 2 alert levels per stage
Building block 3 — Planning
The schedule calculated, no longer keyed in
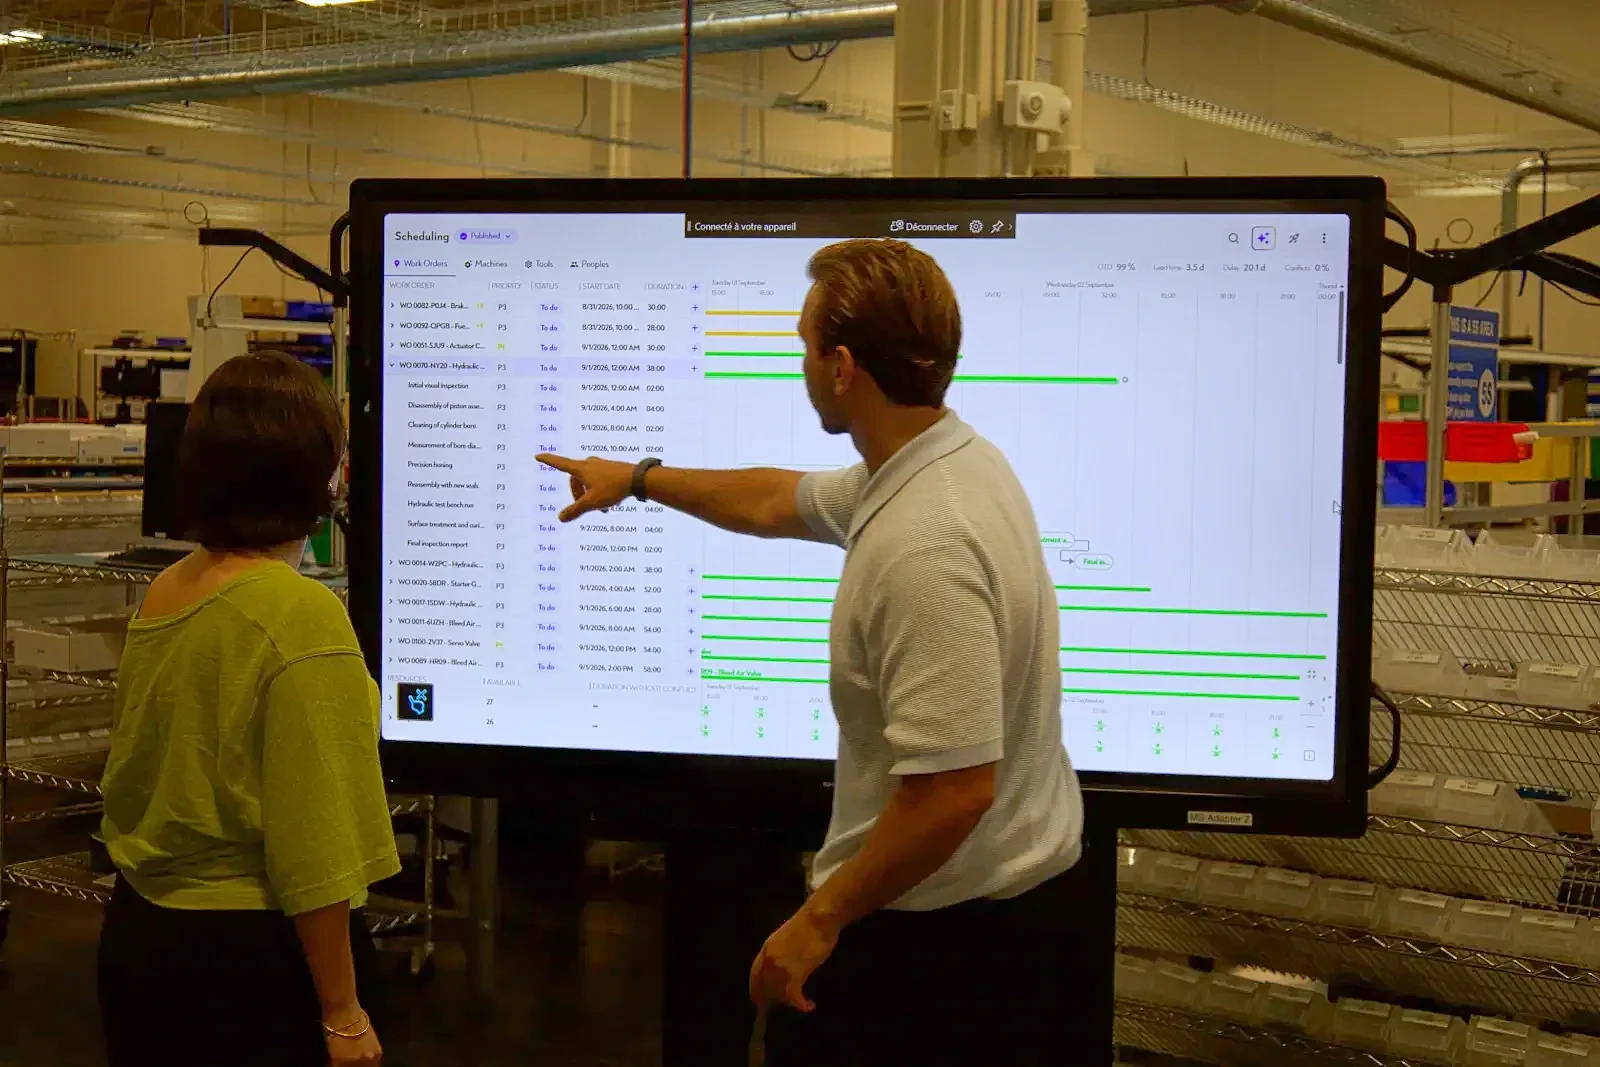
Once the tracking data was reliable and continuous, the planning module replaced the Excel file — not as a digital copy of the spreadsheet, but as a tool fed automatically.
- Containers due within the next 7 days, by department and by capacity
- On-time completion rate, monthly basis
- Breakdown of late orders by department
- Urgent orders: orders placed less than 24 h before the due date, with monthly history
Building block 4 — Label
The last paper link
To find out a container's exact configuration, the operator had to look for the information elsewhere. A label module printable from the platform was added: a button in the table, a PDF with the full product description.
- Direct printing after the form is submitted
- Next step of the project: the connected electronic label — same information, displayed continuously on the container, updated remotely and geolocated
The initial deployment, on the first site
Item | Volume |
|---|---|
Vessels fitted with a geolocation tag | 40 vessels (+ 8 vessels of a second production type) |
Gateways deployed | 3 |
Zones covered by geolocation | 14 zones |
Tag specification | POM material, IP69K housing, range -30 °C to +60 °C |
The tags were chosen to withstand the production environment: their chemical compatibility with the site's cleaning and disinfection products — Decon, NPD, bleach, IPA, peroxide — was validated before deployment.
The views that replaced the tabs
What people used to look for in Excel, ROBIN calculates.
What people used to look for in Excel | What ROBIN calculates by itself |
|---|---|
Which containers are due this week? | Containers due within the next 7 days, broken down by department and by capacity |
How many did we finish this month? | Containers completed by date and by department, month-to-date total, monthly trend |
How many clean, how many dirty? | Real-time inventory by type and by zone, drawn from geolocation |
Are we meeting our deadlines? | On-time completion rate: % of containers completed before their due date and time |
Who is running late? | Breakdown of late orders by department |
Which maintenance tasks are coming up? | Containers in the dirty zone with maintenance due within 7 days; containers with no maintenance date; containers not yet tagged |
How many urgent orders are we putting up with? | Urgent orders by department — orders placed less than 24 h before the due date, with monthly history |
This last indicator is the one that changes the most: measuring urgent orders means no longer putting up with them as inevitable and starting to address their cause.
Implementation on the ground
One pilot, then three sites.
The deployment followed the ROBIN.Deploy method: a pilot on one site, extension to the full scope, then replication. The trajectory speaks for itself.
Tracking and geolocation pilot
Anchor deployment, tag installation and pairing, team training — within a few days on site. Tanks become traceable and dwell times are timed with no human intervention.
Planning module
Platform configuration based on the indicators co-built with the planning teams: due dates, on-time completion, delays by department, urgent orders, maintenance due.
Delivered 3 weeks after specification sign-offExtension: full deployment, then two other sites
The project was extended to the full deployment of the first site, then to a second US site, then to a French site in the midst of industrial expansion — a new building of over 5,000 m².
Measured results
The schedule is calculated, no longer keyed in.
- 3 wksbetween specification sign-off and the delivered configuration of the planning platform
- 4 hahead of the maximum deadline for the first automatic alert — 2 alert levels per step
- 3sites deployed — a pilot that became a full deployment, then two replications
- 0manual dwell-time readings — geolocation starts the clock on zone entry
Other benefits observed or expected: fewer intermediate and finished products lost to time overruns; service level measured as % on-time completion, by month and by department; automated, auditable traceability, usable during inspections; potential throughput gain through sustained use of validated minimum times.
What comes next
At the French site: from planning to automatic scheduling.
The French site pushed the logic one step further. The goal is no longer just to move away from Excel, but to automate scheduling — tracking and geolocation supply the real data, and dynamic scheduling relies on it to make decisions.
- Automatic allocation of resources — operators, machines, tools — to work orders
- Intelligent sequencing of WOs according to operational constraints and business priorities: reduced WIP and lead time
- Integration of the operators' skills matrix and certifications
- Digitisation of the Excel sheet tracking WO receipt
- Automatic calendar creation, easier updates
- Schedule adherence indicators, management of equipment cleaning times and container cycles
Before you start
What this project required, in practice.
The four questions every industrial leadership team asks before signing, and the answers as they were borne out on this project.
No production downtime
Autonomous wall anchors installed during operations, pilot up and running within a few days. The pilot site switched over first, the other two afterwards.
Qualified for your environment
POM tags, IP69K housing, -30 °C to +60 °C. Chemical compatibility with the site's cleaning products is validated before deployment.
Your rules, not ours
Min/max thresholds, alert levels and planning-module indicators were defined with the process and planning teams, then adjusted without any development.
Auditable traceability
The container's unique ID is paired with the batch number: documentation is automated and usable during inspections. Hosting in France, Europe or the USA.
Go further
Related use cases.

Electronics
Real-time WIP visibility
The scan gives progress, geolocation gives position. It's the combination that ends the search.

Multi-industry
Equipment optimisation and load levelling
Moving from infinite to finite capacity: overloads caught in the calculation, no longer endured.

Industrial job shop
Improve your service level
Make delays visible before they happen: dwell-time thresholds, alerts and shared priorities.
Frequently asked questions
Move beyond the Excel schedule.
We plan in Excel — why change?
Excel can display a schedule, not recalculate it under constraints at every event. It knows neither the real capacity of your resources, nor sequence constraints, nor what is happening on the shop floor right now: the plan is right when printed and wrong an hour later. It relies on manual entry, concentrates errors and exists in only one up-to-date version, held by one person.
ROBIN takes the same data, adds the real constraints and shop-floor data (progress, WIP geolocation), and recalculates automatically at every event. Without that shop-floor data, a new planning tool would just be Excel with a different interface.
Do you need tracking and geolocation to move beyond Excel?
It is the condition for lasting adoption. A digital schedule without automatic shop-floor data reverts to a schedule that requires manual entry. Geolocation eliminates re-keying for everything that can be measured: zone entry and exit, dwell time, inventory, availability.
What is a connected electronic label, and when should you prefer it to a barcode?
It is an electronic label attached to WIP, a container or a pallet, which displays up-to-date information (reference, batch, work order, priority, next step) without being reprinted, and which is geolocated in real time. It replaces the paper label and the job traveller.
A barcode is preferred when the information is stable and WIP volumes are very high; a connected electronic label makes sense when priorities change often, when searching for WIP costs time, or when the goal is a paperless shop floor.
How long does a ROBIN deployment take?
From signature to go-live, allow less than three months in most cases, support included, where heavyweight APS projects take 16 to 24 months. A demonstration on your own data can be set up in a few days.
You then start on a critical scope (a workshop, a line, a resource) and extend at your teams' pace. Most of the work goes into structuring routings and resources, not into configuring the software. The timeline is split into phases, with milestones and success criteria defined at the outset.
Is this compatible with a pharmaceutical environment and its cleaning constraints?
Yes, provided the right hardware is selected. On this project, the geolocation tags are made of POM, with an IP69K casing, operating range −30 °C to +60 °C, and their chemical compatibility with the site's cleaning products was validated prior to deployment.
Take action
Is your schedule still living in an Excel file?
Let's talk about what needs to be in place before replacing it.
30 minutes on your data · Reply within 24 h · No commitment