
Role · Performance Manager
Your KPIs arrive at the start of the month. Your decisions cannot wait.
ROBIN is Zozio's real-time cockpit for complex-flow shop floors. It derives your KPIs from production events: lead time (TAT), on-time delivery (OTD), WIP (work in progress) and plan/actual variance, consolidated shop floor by shop floor across your site. You move from monthly reporting to day-to-day operations management.
They already measure with ROBIN






The three figures
Three key indicators to measure your performance automatically.
These are the ones ROBIN calculates with the same definition for every shop floor, every line and every workstation on your site, and the ones that recur throughout the rest of this page.
OTDOn-Time Delivery
On-time delivery
The share of orders delivered on the promised date. It is also the KPI your customer measures, with their own definitions.
TATTurnaround Time
Lead time
The time between a work order entering the shop floor and leaving it. Its dispersion says more than its average.
Gapplan / actual
Distance from plan
The gap between the published schedule and what actually happened, operation by operation. This is where the root causes lie.
Your challenges
Three things that stand in the way of measuring.
They recur in every complex-flow shop floor: job shop, short runs, one-off parts or maintenance.
Figures that measure the past
A report available on the 5th of the month describes a shop floor that no longer exists. You spot a drift when the orders concerned have already been delivered, or are already late. And without data at the right granularity, it is impossible to see which workstation is really holding up the flow, or whether an isolated delay has spread to ten other work orders.
Answer — ROBIN.DataFlow
- Service (OTD)94,2 %
- Lead time (TAT)−7 %
- FreshnessReal time
KPIs are recalculated at every production event, not at month-end close.
Each department arrives with its own figure
Scheduling, production and quality each pull their data from their own tool. The review starts by arbitrating which figure is the right one, and the action plan waits for the next meeting.
Answer — ROBIN.DataFlow
- Machining shop floor — TAT 38.4 d · OTD 94.2%Reference
- Assembly shop floor — TAT 51.7 d · OTD 88.1%Gap +13.3 d
A single definition of TAT and OTD for the whole site. The review focuses on flows, no longer on each team's calculation method.
A gain you can't manage to prove
An improvement project without a quantified baseline ends in a debate of opinions. Without a before measurement, there is no after demonstration — and the next budget is harder to secure.
Answer — ROBIN.Deploy
Baseline- Baseline
- Measured pilot
- Demonstrated gap
The starting snapshot is taken at the diagnostic, on your data. The built-in metrics then track the gap over time.
The product
ROBIN, the platform that runs the shop floor in real time.
ROBIN has five modules. The one that concerns you first is the data layer: it is what produces the KPIs.
ROBIN.DataFlow
KPIs produced by production itself.
The shop floor's data layer: events collected, shared definitions, usable history.
- TAT, OTD and WIP calculated on the same definitions, across all shop floors
- Plan vs. actual gap operation by operation, for root-cause analysis
- Export and API to your BI: Power BI, Tableau, data warehouse
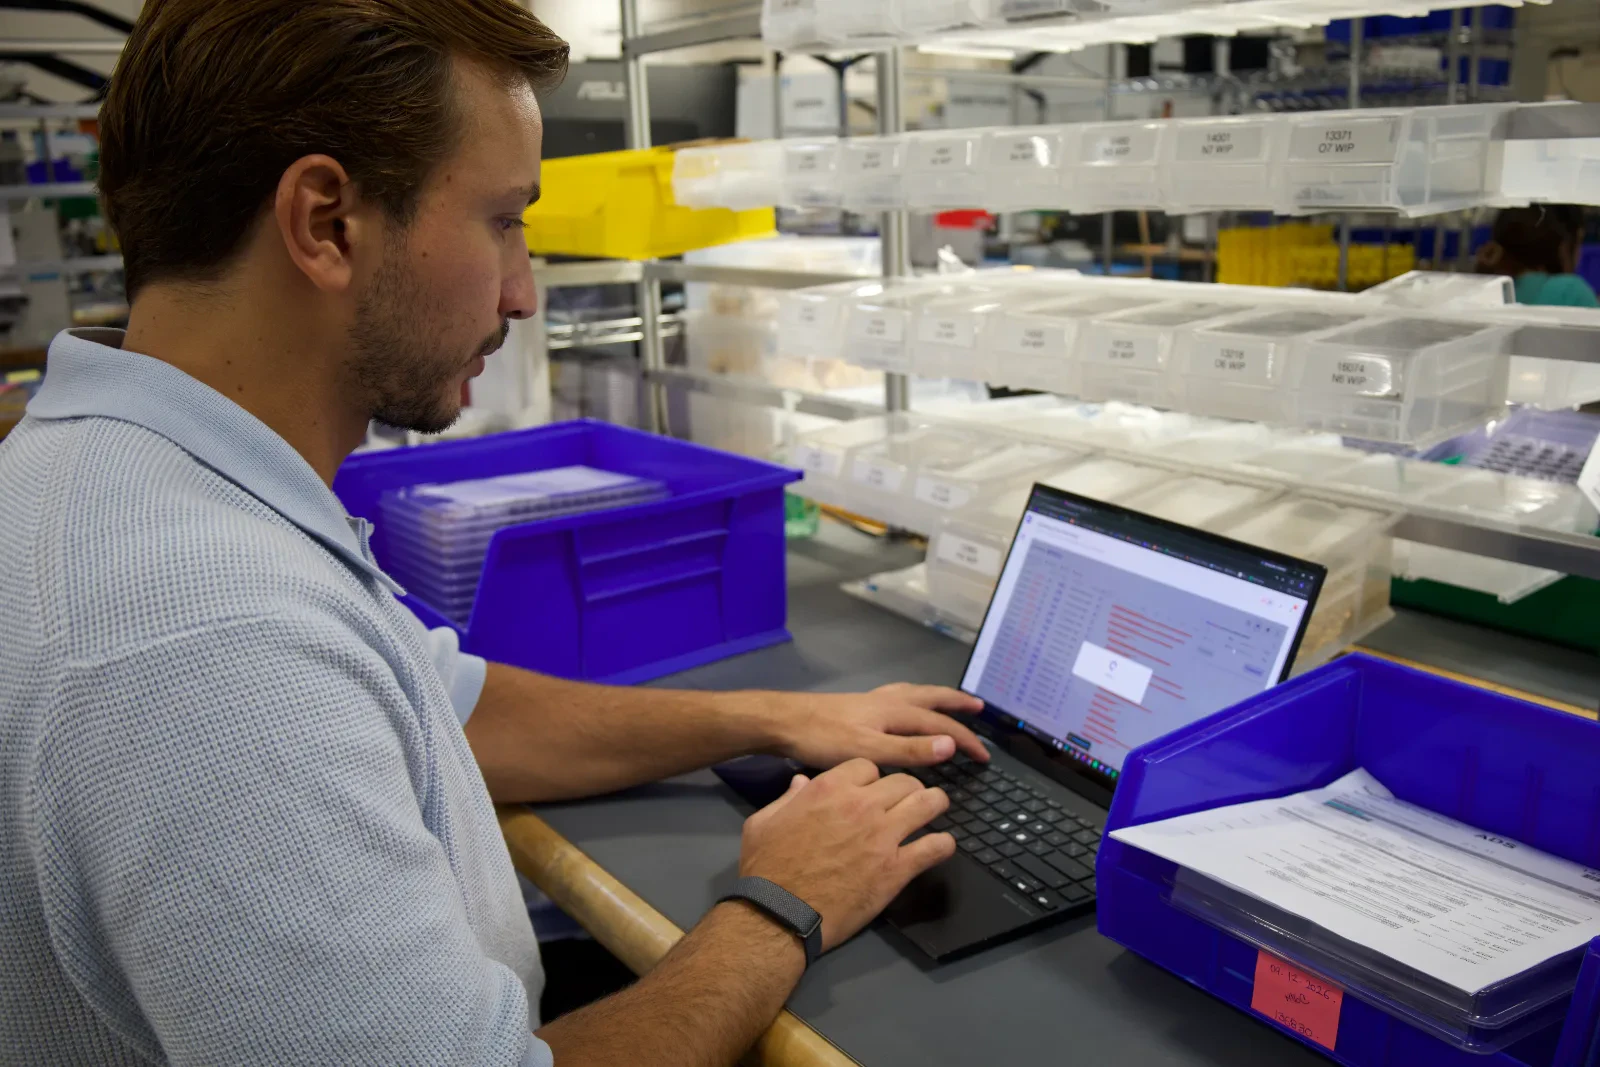
Routing times converge towards actuals.
Every declared operation corrects the routing's theoretical time. Scroll through the weeks below: the gap between plan and actual narrows without a single sheet being re-keyed.
Continuous learning
The gap to reality closes by itself.
Every declared operation corrects the standard times. The plan stops drifting because it learns from the shop floor, not because someone readjusts it by hand.
Planned vs actual routing time
Deburring — finishing station · actual time / standard time ratio
current gap high · +26 %
production weeks
Average ratio
135 %
Standard deviation σ
± 15.2 %
Measurements
24 WOs
Schedule reliability
schedule adherence rate
77 %
Corrections proposed by Robin
Deburring — finishing station
takes +40 % longer than standard on average
Dimensional inspection — CMM
takes +22 % longer than standard on average
Sub-assembly A
takes +31 % longer than standard on average
Robin is observing your actual times… move the weeks forward to see the first corrections.
An order of magnitude modelled from our deployments, not a measurement from a client site.
The calculation
What consolidation costs you in analysis time.
Extracting, cross-checking, formatting: the time spent building the report is time not spent addressing root causes. Enter your orders of magnitude.
Your reporting
Assumption: 70% of consolidation time eliminated, 46 working weeks, 7 hours per person-day. Order of magnitude — the actual baseline is set at the diagnostic, on your data.
The measurement
What we guarantee on the data.
- A quantified baseline set at diagnosis, before any commitment
- KPI definitions written down and shared across your departments
- Your data exportable at any time, via API or file
- A pilot scope measured in under 3 months, then extension
What ROBIN changes
Measurement moves from observation to operations management.
KPIs that are never re-keyed
TAT, OTD, WIP and plan-vs-actual variance are derived from production events. Nobody fills in a file to feed them, so nobody disputes them.
A common language across your departments
One single definition of TAT and OTD, from scheduling to quality. The performance review is about flows, no longer about the figure each person brought along.
Demonstrable gains
Baseline at diagnosis, defined scope, built-in metrics that track the variance. The reasoning stands up to a management controller, and to the executive committee.
The results
What it delivers on a real shop floor.
The gains observed on a defined scope, and the customer case that documents them.
- −7%lead time reduction — observed at an aircraft repair shop
- 94,2%OTD achieved on the tracked scope, measured continuously
- Real timeKPI freshness — instead of the 5th of the following month
- < 3 monthsbetween the baseline and the first variance measured in production
Customer case · Aircraft repair shop
Landing gear: 7% TAT gained without adding capacity.
A European MRO absorbs its disruptions without TAT drift: baseline set at diagnosis, gain measured on the tracked scope, WIP located.
Read the customer case- −7 %TAT on the tracked equipment
- < 2 minto reschedule after a disruption
- 0rescheduling in Excel
The vendor
What you check before connecting a tool to your data.
Your data stays under your control
European cloud hosting or on your own infrastructure, and export of your data at any time. No irreversible dependency.
Plugged into your IT systems
ROBIN reads the ERP, the MES and the CMMS, and exposes its data to your BI. Nothing is replaced.
- SAP
- Sage
- MES
- CMMS
- Power BI
No per-user cost
Rolling out a dashboard to every shop floor and every workstation on the site costs nothing extra. The budget does not depend on the number of readers.
A single point of contact
A ROBIN.Deploy project manager sets the baseline with you, writes the KPI definitions and tracks variances until your teams are autonomous.
Further reading
What we write for a performance manager.

Dynamic scheduling · Thesis
MRO scheduling: why static scheduling drags down your TAT
It is not variability that degrades TAT — it is the tool that pretends it does not exist.

Customer case · Aerospace
Reducing TAT on a landing gear shop floor
The details of the project: baseline, scope, measured results and deployment timeline.
FAQ · Performance
The questions we get asked in performance reviews
Where do ROBIN's indicators come from?
How is the baseline established before deployment?
Can the shop floors and lines at my site be compared with one another?
Yes, provided definitions are shared: ROBIN applies the same TAT and OTD calculation method to every shop floor, line, and workstation on the site. This is often the first benefit observed — a common language between scheduling, production, and quality, even before performance gains are realised.
Can data be exported to Power BI or a data warehouse?
How do you prove the gain comes from ROBIN and not something else?
The pilot covers a defined scope, with a quantified baseline and a control group where possible. The built-in metrics track the variance over time, operation by operation. The reasoning holds up under management accounting scrutiny.
Should we stop our existing reporting?
No. During the pilot, both run in parallel: this is what allows definition discrepancies to be verified. Manual reporting stops when your teams find it is saying exactly the same thing — only later.
Take action
A KPI from today is worth more than a report from last month.
Our teams set the baseline on your data, write the definitions with you and define the measurement scope.